Schlumberger Ltd.

Therefore, it is not possible to provide a detailed answer regarding their environmental policy or their net zero target based on the given text. Corporate Climate Responsibility Monitor 2022"
Greenhouse Gas Emissions
Last 3 Years Emissions Data Summary
| Y2022 | Y2021 | Y2020 | |
|---|---|---|---|
| Scope 1 | 1,483,000 | 1,369,000 | 1,125,000 |
| Scope 2 - location-based | NA | NA | NA |
| Scope 2 - market-based | 312,000 | 375,000 | 511,000 |
| Scope 1-2 - location-based | 1,483,000 | 1,369,000 | 1,125,000 |
| Scope 1-2 - market-based | 1,795,000 | 1,744,000 | 1,636,000 |
| Scope 3 | 34,850,000 | 27,375,000 | 38,127,000 |
| Total - location-based | 36,333,000 | 28,744,000 | 39,252,000 |
| Total - market-based | 36,645,000 | 29,119,000 | 39,763,000 |
Note: Data sources detailed here
| Y2022 | Y2021 | |
|---|---|---|
| Total CO2e estimate (by Net0Tracker) | 36,645,000 | 29,119,000 |
| Methodology | As reported | As reported |
Carbon emissions are estimated according to comparable years, intensity and sector benchmarks
Performance vs. Target
Value Chain (scope 3) Emissions by Category
Emissions Trajectory (Full Scopes)
Please refer to the library for viewing the supporting documentation
Sector Benchmark
Note: Latest GHG and revenue data (based on tradingview.com) are used to calculate GHG emissions intensity by sector. The color scale of each bubble depends on the GHG intensity (GHG emissions per 1 million USD revenue). Sectors follow the Global Industry Classification Standard (GICS) that organize companies based on their primary business activities. The 11 sectors are : Information Technology, Health Care, Financials, Consumer Discretionary, Communication Services, Industrials, Consumer Staples, Energy, Utilities, Real Estate, and Materials.
Schlumberger Ltd. belongs to the sector Energy.
Reduction and Net Zero Targets
>Note: intensity targets are not represented in the current version - see Methodology
Gross Absolute Emission Reductions
| Scope | Reduction Objectives | Base Year | Target Year | Comments |
|---|---|---|---|---|
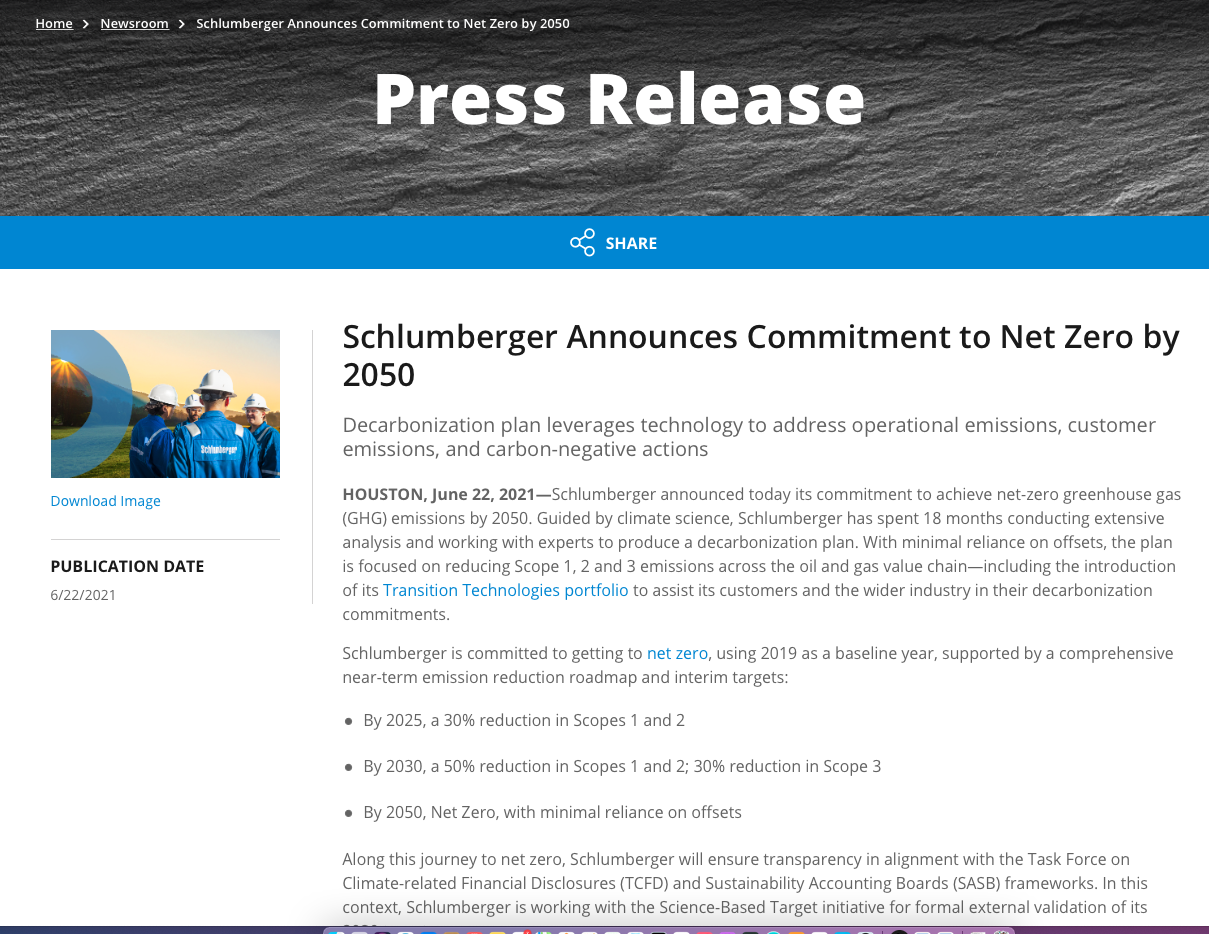
| S1S2MKT | 30.0 | 2019 | 2025 | |
| S3 | 30.0 | 2019 | 2030 | |
| S1S2S3MKT | 31.0 | 2019 | 2030 | |
| S1S2MKT | 50.0 | 2019 | 2030 |
Net Absolute Emission Reductions
| Scope | Reduction Objectives | Base Year | Target Year | Comments |
|---|---|---|---|---|
| S1S2S3MKT | 100.0 | 2019 | 2050 |
Net Zero Future Commitments
| Scope | Scope 3 Coverage | Target Year | Comments |
|---|---|---|---|
| S1S2S3LOC | FULL | 2050 |
Offsets
Last update for Schlumberger by zerotracker.net: March 23, 2023| Planning to use external offset credits | Not Specified |
| Separate targets for emission reductions and removals | No |
| Conditions on use of offset credits | None |
| Plans for carbon dioxide removal (CDR) | Yes (CCS-based removals e.g. BECCS, DACCS) |
Additional notes: "In addition, carbon negative actions such as bioenergy with carbon capture and storage, are meant to help us achieve our net zero goals with minimal reliance on offsets." (Schlumberger, 2021 Sustainability Report, pg 8) https://www.slb.com/-/media/files/sustainability/2021/2021-slb-sustainability-report.ashx "For emissions that cannot be reduced, rather than relying on traditional offsets, we will rely on our carbon-negative actions that are technology-centric, where we can play a role, such as through our Schlumberger New Energy portfolio described above under “Climate Action”—New Energy & Transition Opportunities." (Schlumberger, 2021 Sustainability Strategy, pg 34) https://www.slb.com/-/media/files/sustainability/2021/2021-slb-sustainability-report.ashx Involved in CCS (https://newenergy.slb.com/new-energy-sectors/carbon-capture-and-sequestration) but looking for "minimal reliance on offsets". Specifics not mentioned.
Score Summary
| Ref | Principle |
Score
(points) |
Max
(points) |
Delta
(points) |
|---|---|---|---|---|
| 1 | At least 2 years of GHG emissions for scope 1 and 2 are publicly-available and externally-verified | 10.0 | 10.0 | 0.0 |
| 2 | Scope 3 emissions are fully reported and externally-verified | 7.5 | 10.0 | -2.5 |
| 3 | CDP score demonstrates the level of transparent disclosures | 6.0 | 10.0 | 0.0 |
| Transparency | 23.5 | 30.0 | -2.5 | |
| 4 | Net Zero Commitments by 2050 include an intermediate target and cover all the emissions | 10.0 | 10.0 | 0.0 |
| 5 | Net Zero targets demonstrate a high-level of emergency | 0.0 | 10.0 | 0.0 |
| 6 | Emission reduction targets on a forward-looking basis are ambitious | 5.0 | 10.0 | 0.2 |
| 7 | Targets are science-based as validated by SBTi | 0.0 | 10.0 | -2.5 |
| Commitments | 15.0 | 40.0 | -2.3 | |
| 8 | Results re. operational emissions reduction: on-pace (performance-to-date) and momentum (forward-looking targets) | 0.0 | 10.0 | -5.0 |
| 9 | Results re. value chain emissions reduction: on-pace (performance-to-date) and momentum (forward-looking targets) | 5.0 | 10.0 | 0.0 |
| 10 | Implied Temperature Rating by MSCi | 10.0 | 10.0 | 2.5 |
| Results | 15.0 | 30.0 | -2.5 | |
| Total | 53.5 | 100.0 | -7.3 |
Score Details
| Criteria | Results | 2023 Score | 2022 Score | Vs. 2022 | 2021 Score |
|---|---|---|---|---|---|
| Criteria 1 : Transparency on operational emissions (Scope 1 + 2) | |||||
| Are S1+S2 figures publicly-disclosed for the last reporting year and the preceding period? | yes | 5.0 / 5.0 | 5.0 | 0.0 | 5.0 |
| Are S1+S2 figures verified by a 3rd-party for the last reporting year? | yes | 5.0/ 5.0 | 5.0 | 0.0 | 5.0 |
| Criteria 2 : Transparency on value chain emissions (Scope 3) | |||||
| Are the 15 categories fully or partly disclosed? | full | 5.0 / 5.0 | 5.0 | 0.0 | 5.0 |
| Are S3 figures fully or partly verified by a 3rd-party for the last reporting year? | partly | 2.5 / 5.0 | 5.0 | -2.5 | 2.5 |
| Criteria 3 : Quality and Frequency of reporting | |||||
| What is the latest CDP score (no later than the preceding year)? | C | 6.0 / 10.0 | 6.0 | 0.0 | 8.0 |
| How many interim reporting were provided between 2 reporting periods (GHG emissions only)? | |||||
| Criteria 4 : Net Zero Commitments | |||||
| Does the net 0 target include a statement of a generally-accepted net zero emission target by 2050? | yes | 3.0 / 3.0 | 3.0 | 0.0 | 3.0 |
| Does the net zero target include an intermediate target by 2030? | 2025 | 3.0 / 3.0 | 3.0 | 0.0 | 3.0 |
| Does the net zero target include all the emissions? | yes | 4.0 / 4.0 | 4.0 | 0.0 | 4.0 |
| Criteria 5 : Target year for Net Zero Commitments | |||||
| Target year for achieving net zero emissions for S1+S2? | 2050 | 0.0 / 5.0 | 0.0 | 0.0 | 0.0 |
| Target year for achieving net zero emissions for S1+S2+S3 combined? | 2050 | 0.0 / 5.0 | 0.0 | 0.0 | 0.0 |
| Criteria 6 : Reduction objectives | |||||
| What is the forward-looking GHG% reduction (without compensation) for scope 1+2? | 7.1 | 5.0 / 5.0 | 4.8 | 0.2 | 3.2 |
| What is the forward-looking GHG% reduction (without compensation) for scope 1+2+3? | -0.2 | 0.0 / 5.0 | 0.0 | 0.0 | 0.0 |
| Criteria 7 : Science-Based Targets | |||||
| What type of science-based target (as validated by SBTi) did the company commit to? | NC | 0.0 / 10.0 | 2.5 | -2.5 | 2.5 |
| Criteria 8 : Results based on scope 1 - 2 | |||||
| Performance to date: cumulative% reduction vs. target |
Objective (in %):
15.0
Actual (in %): 11.0 |
0.0 / 5.0 | 5.0 | -5.0 | 5.0 |
| Momentum: last year % reduction vs. forward-looking target |
Objective (in %):
7.1
Actual (in %): -2.9 |
0.0 / 5.0 | 0.0 | 0.0 | 5.0 |
| Criteria 9 : Results based on scope 1 - 2 - 3 | |||||
| Performance to date: cumulative% reduction vs. target |
Objective (in %):
8.5
Actual (in %): 32.3 |
5.0 / 5.0 | 5.0 | 0.0 | 0.0 |
| Momentum: last year % reduction vs. forward-looking target |
Objective (in %):
Actual (in %): Forward-looking reduction could not be calculated
|
0.0 / 5.0 | 0.0 | 0.0 | 0.0 |
| Criteria 10 : Implied Temperature Rise (ITR) | |||||
| Is the company aligned with global climate targets? | ITR: 1.5°C | 10.0 / 10.0 | 7.5 | 2.5 | 0.0 |
| Total | 53.5 / 100.0 | 60.8 | -7.3 | 51.2 | |
Available Data Sources
| Reporting Year | 2022 | 2021 | 2020 | 2020 | 2020 | 2019 | 2019 | 2019 | 2019 |
|---|---|---|---|---|---|---|---|---|---|
| Source | Public | Public | Public | Public | CDP | Public | Public | CDP | Public |
| Publication Year | 2023 | 2022 | 2022 | 2022 | 2021 | 2022 | 2022 | 2021 | 2021 |
| Scope 1 | 1,483,000 | 1,369,000 | 1,125,000 | 1,424,000 | 1,125,000 | 1,386,000 | 1,668,000 | 1,386,000 | 1,629,000 |
| Scope 2 - location-based | NA | NA | NA | NA | 511,000 | NA | NA | 631,000 | 0 |
| Scope 2 - market-based | 312,000 | 375,000 | 511,000 | 527,000 | 511,000 | 631,000 | 650,000 | 631,000 | 589,000 |
| Scope 1-2 - location-based | 1,483,000 | 1,369,000 | 1,125,000 | 1,424,000 | 1,636,000 | 1,386,000 | 1,668,000 | 2,017,000 | 1,629,000 |
| Scope 1-2 - market-based | 1,795,000 | 1,744,000 | 1,636,000 | 1,951,000 | 1,636,000 | 2,017,000 | 2,318,000 | 2,017,000 | 2,218,000 |
| Scope 3 | 34,850,000 | 27,375,000 | 38,127,000 | 30,137,001 | 38,493,000 | 52,135,000 | 44,385,000 | 0 | 0 |
| Total - location-based | 36,333,000 | 28,744,000 | 39,252,000 | 31,561,001 | 40,129,000 | 53,521,000 | 46,053,000 | 2,017,000 | 1,629,000 |
| Total - market-based | 36,645,000 | 29,119,000 | 39,763,000 | 32,088,001 | 40,066,000 | 54,152,000 | 46,703,000 | 2,017,000 | 2,218,000 |
Sources
- CDP: Data from CDP Climate Change Questionnaire - see Free SFDR data library
Please refer to the library for viewing the supporting documentation
Library
Sustainability Reports
GHG DATA
Disclosures - Verification
Targets reporting
© Vincent Manier - September 2021 About us . Keep in touch . Blog